
Conseil National de Recherches Canada
|
Beginning of the year 2016 I worked for 3 month at the National Research Council (CNRC/NRC) in Boucherville, Canada
as a visiting research fellow.
The National Research Council is the primary national research and technology organization (RTO) of the Government
of Canada, in science and technology research and development.[1] The Minister of Innovation, Science, and
Economic Development is responsible for the NRC.
NRC is uniquely positioned to deliver a compelling value proposition to our clients and collaborators through a
focus on commercial success and tangible impacts on industrial growth. NRC encourages and engages in multiple forms
of collaboration for a project. Our collaborative research projects span a very broad spectrum of activities and
business structure models.
Access to NRC expertise and equipment provides our collaborators with the opportunity to accelerate their commercial
development timelines, while a focus on industrial applications provides NRC with insights into commercial direction
for research and technology development activities.
[Online] CNRC/NRC [cited at: 19. April 2016.] http://www.nrc-cnrc.gc.ca/eng/index.html
For further details see:
CNRC/NRC
During my stay I was involved in optimising the X-ray Micro-CT, the existing image analysis systems as well as the implementation of
new analysing methods to investigate titanium powders and foams.
The background of my work was motivated by large scale deployment of additive manufactoring processes (AM) as part quality relies specifically on
the presence of internal defects and part-to-part consistency. Some of the defects observed in finished parts have been
associated with porosities in the powder feedstock used in AM processes including powder bed, laser cladding, and
cold spray. Since the level of porosity in these powders is generally very low, standard characterization techniques
such as pycnometry, and metallography with image analysis, are not suitable for quantification. Investigating powders by
using X-ray tomography and image analysis offer a new approach combining high resolution images with an automated
3D image analysis routine to evaluate and quantify porosity in titanium powder feedstock. The effects of acquisition
parameters and image analysis procedures on porosity quantification were investigated to validate the proposed method
and assess its reliability. Data demonstrate that the proposed technique is sufficiently sensitive to differentiate
powders with different porosity levels.
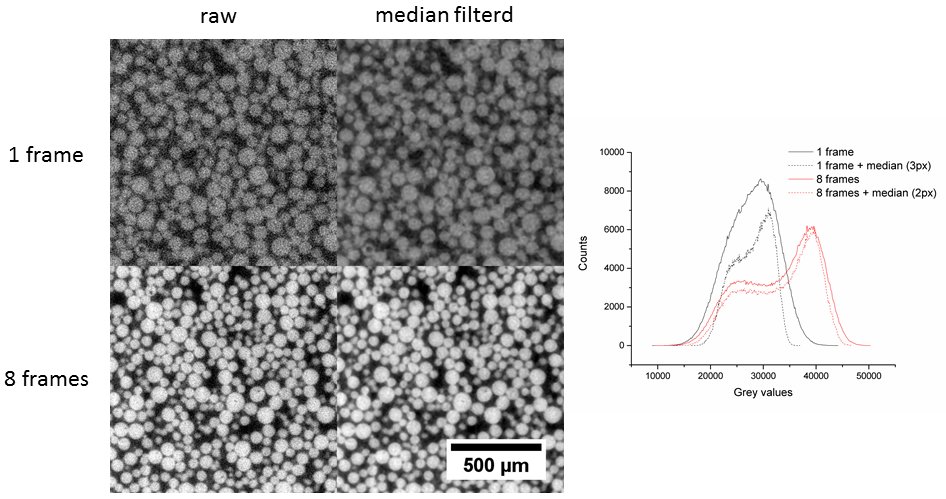
First we concentrated on the image acquiring process by X-ray tomography to achieve optimal raw data. The first figure
compares the obtained results when the images of the powder (Ti) are averaged on 8 frames or not; the impact on the grey value scales is
also shown. Finally, one of the first steps during the image analysis routine is to use a median filter to increase phase
distinction: the impact of the filter on the images and grey values is presented in Figure 1 too.
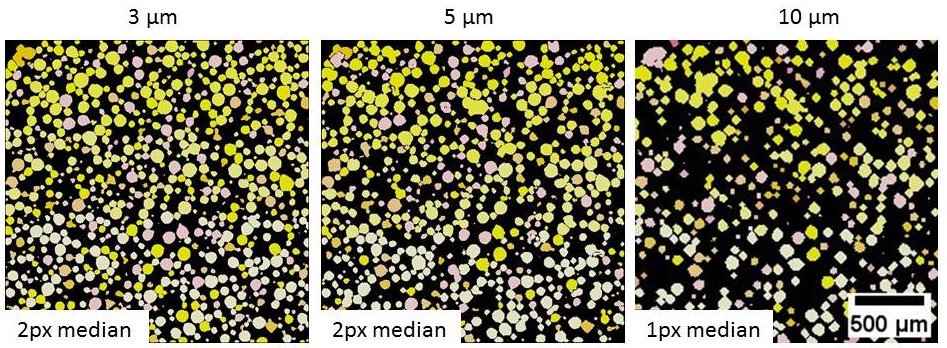

2D slice
|
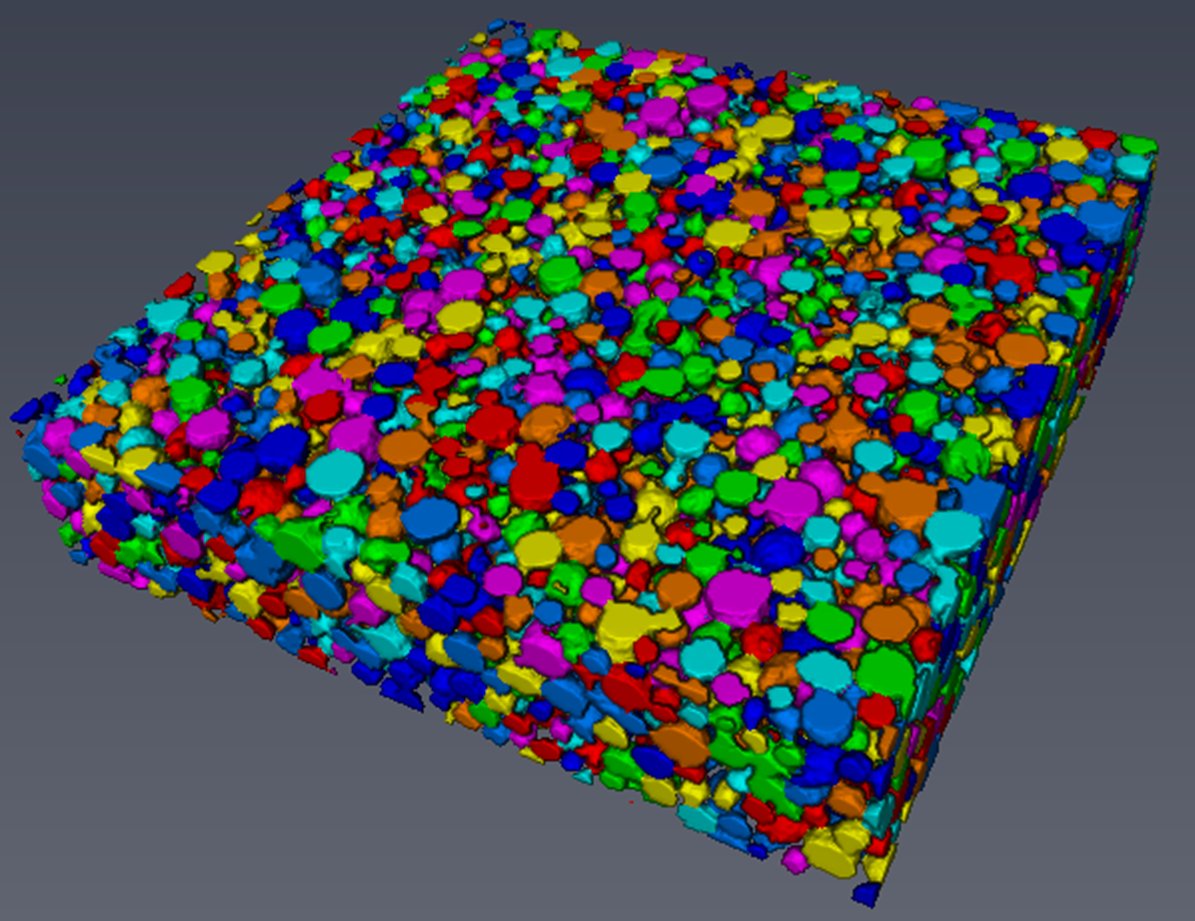
3D reconstruction
|
Separated pores in 3D